




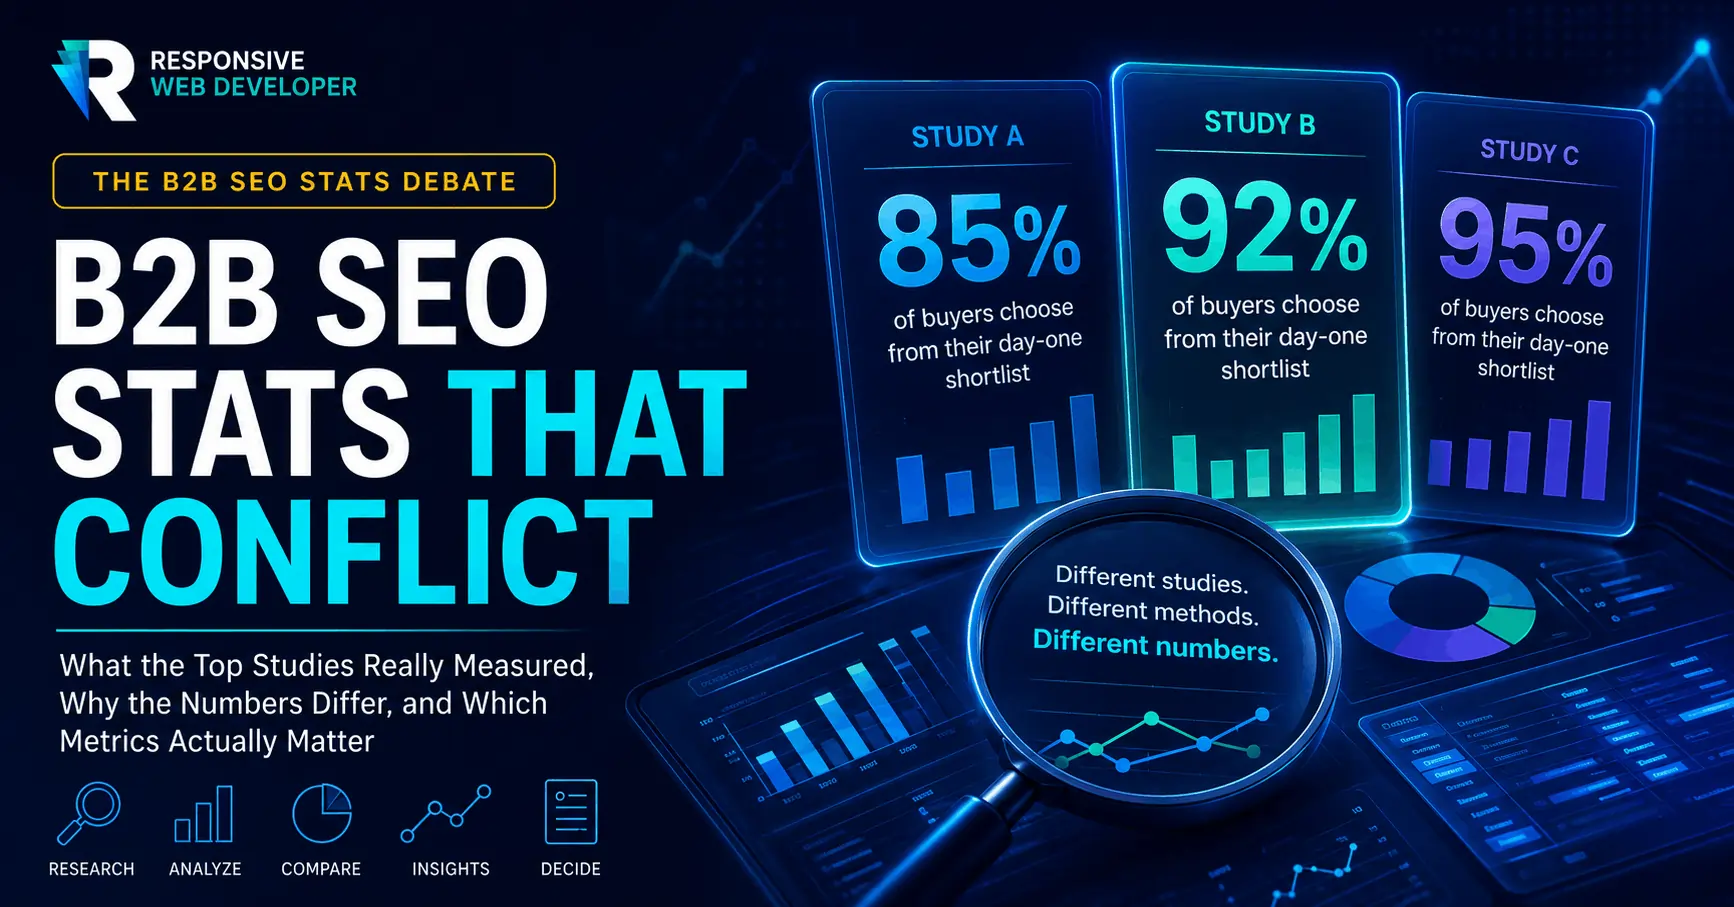
Two of the most-cited B2B SEO statistics in circulation say that buyers choose a vendor from their day-one shortlist 85% of the time and 95% of the time. Both come from named research. Both were measured carefully. Neither is a typo.
That is the real problem with B2B SEO statistics right now. The numbers are not fake. Several credible studies measured overlapping things, got different answers, and the roundups stripped out the methodology that explains the gap.
So you cite the 85%. Someone in the room searches for it, finds the 95%, and your slide loses the argument. The number was fine. The framing was not.
What follows is organized around seven disagreements: what each study actually measured, why the answers differ, and which figure to use depending on what you sell. Then five numbers that should stop appearing in decks, and five metrics worth tracking instead.
If you need a number in the next five minutes
These hold up best under questioning, because each one names its sample and its method.
- Users clicked a traditional result on 8% of searches where an AI summary appeared, against 15% where one did not. Pew Research Center, based on 68,879 real searches from 900 US adults.
- 95% of B2B buyers purchased from a vendor already on their day-one shortlist. 6sense 2025 Buyer Experience Report, nearly 4,000 respondents, median purchase value between $200,000 and $300,000.
- AI Overviews appeared on 36% of B2B technology queries in February 2025 and 82% twelve months later. BrightEdge, tracked daily.
- 96.55% of pages get no organic traffic from Google. Ahrefs, roughly 14 billion pages, 2023 data. General web, not B2B specific.
- Roughly 5.7% of new pages reach the top 10 within a year of publication, and those that do usually take two to six months. Ahrefs.
- The top 10% of B2B SaaS sites grew organic traffic 112.3% while the average grew 16.3%. Stratabeat, 300 B2B SaaS websites. That gap is about 6.9x, which is a bigger lever than any algorithm update.
- 87% of B2B marketers using AI for content said productivity improved. Only 39% said content performance improved. Content Marketing Institute and MarketingProfs, 1,015 B2B marketers, fielded June to August 2025.
Everything below is reported as the named study reported it. Trace anything load-bearing back to the primary source before it goes in front of a finance team.
Disagreement 1: How often buyers pick from the day-one shortlist
The numbers: 85% (Bain, September 2025). 92% (Google and Bain research). 95% (6sense, 2025 Buyer Experience Report).
Why they differ: different populations, different years. The 6sense figure moved from 85% to 95% between consecutive waves of the same study, which is exactly why last year’s reading still circulates as current. The Google and Bain 92% rests on an older dataset. Deal size matters too, since 6sense respondents skewed toward six-figure purchases.
Which to use: the most recent wave of whichever study matches your average contract value, with the year attached.
All three point the same direction, which is worth saying out loud when you present one. The shortlist forms before you know it exists. The disagreement is about magnitude, not about whether the effect is real, and saying so preempts the objection.
Disagreement 2: How much AI Overviews cut clicks
Five credible figures answer what looks like one question:
| Finding | Source | What it measured |
|---|---|---|
| 34.5% lower CTR | Ahrefs, March 2025 data | CTR of top-ranking page on AIO keywords |
| 58% lower CTR | Ahrefs, December 2025 data, 300,000 keywords | Same measure, updated |
| ~47% relative drop | Pew Research | Per-search click probability (8% vs 15%) |
| 38% fewer clicks | Agarwal and Sen, SSRN preprint, not peer reviewed | Randomized field experiment |
| 61% lower CTR | Seer Interactive, 25.1M impressions, 42 organizations | Organic CTR fell 1.76% to 0.61% |
Three different units are hiding inside one headline. Ahrefs measures the click-through rate of a ranking page through Search Console. Pew measures the probability a person clicks anything at all on a given search, through a browsing panel. The field study isolates causation by randomly assigning who sees a summary.
Seer adds a detail that matters for budget conversations: paid CTR fell further than organic on the same queries, from 19.7% to 6.34%. That removes the obvious hedge of shifting spend into ads.
Which to use: the field experiment for causal claims, Pew for user behavior, Ahrefs when discussing a specific page. Name the method in the same sentence. Six extra words make you the hardest person in the room to challenge.
Disagreement 3: Whether anyone clicks the citations
Pew found links inside AI summaries were clicked on 1% of visits. TrustRadius, surveying 2,058 technology buyers, found 90% of those who encountered an AI Overview clicked at least one cited source.
These look irreconcilable. They are not. Pew reports a rate per search across all searches, most of which are low-stakes lookups where the summary is the entire answer. TrustRadius reports incidence per buyer across an entire technology purchase. One asks what fraction of searches produce a citation click. The other asks what fraction of buyers ever click one.
For B2B, the second framing is the relevant one, and it is the more encouraging of the two. People spending real money verify what they read.
Seer supports the same conclusion from another angle: organic CTR of 0.70% when a brand appears inside the AI Overview, 0.52% when it does not, and 1.45% when no AI Overview appears at all. Citation is worth roughly 35% more clicks. It is not worth what a clean results page used to be.
Disagreement 4: Whether zero-click search is rising at all
SparkToro, using Similarweb clickstream data, put US zero-click searches at 68% for the January to April 2026 window, against roughly 45% a decade earlier.
Semrush and Datos analyzed more than 200,000 keywords across 2025 and found something else. For keywords that started triggering AI Overviews during the study period, the zero-click rate went down, from 33.75% to 31.53%.
The reconciliation is selection effect. AI Overviews appear disproportionately on informational and definitional queries, which already had high abandonment before summaries existed. Pew found 53% of searches containing ten or more words triggered a summary, as did 60% of searches beginning with a question word. Those are precisely the searches people were already ending without a click.
Which to use: SparkToro for the aggregate trend. Semrush and Datos when someone claims AI Overviews single-handedly killed traffic, because the causal evidence for that specific claim is thinner than the headlines suggest. The randomized study above remains the strongest causal reading available, and it landed at 38%, the low end of the range.
Disagreement 5: How much AI citations overlap with organic rankings
This is the one that should change a B2B roadmap.
- Roughly 17% of AI Overview citations come from pages in the organic top 10 (BrightEdge)
- 38%, down from 76% in the previous run (Ahrefs, February 2026, 863,000 keywords and 4 million AI Overview URLs)
- Roughly 86% at the domain level for AI Overviews, roughly 54% for AI Mode (Semrush)
- 88% of Google AI Mode citations do not appear in the organic top 10 (Moz, nearly 40,000 queries)
- 71.0% overlap in B2B technology specifically (BrightEdge, September 2025)
Three variables explain that spread. URL-level overlap runs far below domain-level overlap, so a study reporting 86% and one reporting 38% may agree completely. AI Overviews still lean on the classic index while AI Mode runs its own fan-out queries across a much wider pool. And vertical matters enormously.
Which to use: if you sell B2B software, cite the vertical figure and say so. Cross-industry averages understate how much your rankings still do for you, by a factor of four.
One more finding from the Ahrefs dataset worth knowing: YouTube accounted for nearly 6% of all AI Overview citations, and more than 18% of citations from pages not ranking in the top 100 at all.
Disagreement 6: Whether AI referral traffic converts better
Supporting the premium: a Seer Interactive B2B client recorded ChatGPT referrals converting at 15.9% against 1.76% for Google organic. Ahrefs found 0.5% of its visitors arrived from AI search and drove 12.1% of signups, a 23x multiplier. Semrush modeled AI search visitors at roughly 4.4x the value of organic ones.
Against it: an analysis of 973 ecommerce sites covering $20 billion in revenue found ChatGPT referrals made up about 0.2% of sessions and converted worse than Google search. Amsive found no significant difference at all.
The reconciliation is category, and it favors you. The conversion premium shows up in research-heavy considered purchases, where the assistant has effectively pre-qualified the visitor. It does not show up in transactional ecommerce. B2B software sits squarely in the first group.
The denominator matters more than the multiplier. Seer’s 15.9% came from roughly 1,370 conversions against nearly 14 million organic sessions. A 23x rate on half a percent of traffic is worth capturing and not worth reforecasting around. Anyone telling you to move budget out of organic search and into AI optimization is reading half the data.
Disagreement 7: How much buyers want sales out of the process
Gartner gets cited at both 61% (survey of 632 buyers) and 75% for the share of B2B buyers preferring a rep-free experience. Google and Bain found 70% of enterprise buyers strongly agreed they would rather research independently before speaking with a rep.
Those are three different questions. “Prefers an overall buying experience without a sales rep” and “prefers to research independently before contacting sales” are not the same claim, and the second is far weaker than how it usually gets quoted. Gartner also attached a caveat that almost never survives republication: fully self-service purchases correlate with higher purchase regret.
The same erosion shows up in the journey-completion stat. 6sense found first contact moved from roughly 69% of the way through the journey in 2024 to 61% in 2025, with average cycle length falling from 11.3 months to 10.1. The widely quoted “buyers complete 70% of the journey alone” is now a previous-year reading, and the direction of travel is toward earlier contact. At least one widely shared roundup reported the shift as “up from 69%,” which reverses the finding entirely.
Which to use: quote the exact question the survey asked. If you cannot find it, cut the stat.
The four-part test
Before any figure goes in a deck, you should be able to say four things in one breath: who ran it, how many people or pages, when, and what exactly was measured.
That last one does more work than the other three combined. “Search drives 76% of B2B traffic” and “organic search drives 76% of B2B traffic” are different claims, and one of them is wrong.
Five numbers that no longer earn their slide
“93% of online experiences begin with a search engine.” Circulating since at least 2017, usually credited to Forrester, with no linkable study behind it.
“76% of B2B website traffic comes from search engines.” Traces to BrightEdge channel research from 2019 that measured organic and paid search combined. The organic-only figure in that same report was 64.1%. It gets miscited as organic-only constantly, and it predates AI Overviews entirely.
“Traditional search volume will drop 25% by 2026.” A Gartner press release dated February 19, 2024, and a scenario forecast rather than a measurement. The horizon has passed. Query volume did not collapse. Clicks did. Predictions with expired deadlines should be scored, not recycled.
Any SEO ROI figure above 500%. The most-quoted benchmark puts average B2B SEO ROI near 748%, and B2B SaaS around 702% with a seven-month break-even. It comes from an agency analyzing its own client roster, a self-selected sample of companies that stayed long enough to be measured. Directionally interesting, useless as a budget input. Model your own payback with your fully loaded SEO spend, organic-attributed customer count, opportunity-to-close rate, ACV, gross margin, and sales-cycle length, not an agency benchmark.
Aggregate AI Overview trigger rates, if you sell B2B technology. The cross-industry figure understates your exposure by roughly half. Yours is closer to 82%.
Five metrics worth tracking instead
- Citation share for your 20 highest-intent category queries. Run them manually through Google, ChatGPT, Gemini and Perplexity once a month and record whether you appear. It is the closest thing to a rank tracker in this environment.
- Branded search volume, plotted against your publishing and PR dates. When someone meets your brand inside an AI answer and does not click, a branded search two weeks later is often the only trace they leave.
- Impressions against clicks in Search Console, as a ratio over time. Rising impressions with flat clicks tells you what is happening months before revenue does.
- AI referrals as a named channel in GA4. Estimates of how many marketers do this range from 14% to 22% depending on the survey, which means the highest-converting traffic on most B2B sites currently lands in “direct” or “referral” and vanishes.
- Organic-influenced pipeline rather than organic-sourced. Last-touch reporting assigns all credit to the final interaction, so it excludes earlier research touches by design. Dreamdata’s B2B benchmark illustrates how large the difference can be: email appeared on 17% of won deals under first-touch attribution, only 3% under last-touch, and nearly 30% under its data-driven model—a tenfold range between the lowest and highest readings. In a long, anonymous buying process involving multiple stakeholders, report both sourced and influenced pipeline rather than pretending one attribution model contains the whole answer.
One split belongs above all five: separate branded from non-branded organic reporting. Blended, a funding announcement or a product launch can mask a decline in discovery traffic for two full quarters.
The takeaway
The useful thing about B2B SEO statistics in 2026 is not any single number. It is that the disagreements are legible. Two studies reach different answers because they asked different questions of different people at different times, and once you can name which, you can pick the right figure and defend it against anyone who arrives with a different one.
Every study here agrees on direction. Buyers research obsessively, they build the shortlist before you know they exist, and more of that research now happens in places that never send you a session.
Pick three numbers from this post that map to a decision you are making this quarter. Write each into your planning doc with the study, the sample and the year beside it. Then do the branded and non-branded split. It takes an hour, it costs nothing, and it will tell you which half of the story your own analytics has been hiding.
Related Articles:
- B2B SEO Tools 2026: Real Prices, Real Blind Spots
- Best B2B SEO Services: Vet the Agency, Then Yourself
- B2B SEO Best Practices That Drive Pipeline
- B2B SEO Solutions: Fix the Right Problem First
- B2B SEO Strategy: A Coverage Grid That Builds Pipeline
- B2B SEO Specialist: Hire for Pipeline, Not Traffic
- B2B SEO Consultant: How to Hire One Who Moves Pipeline
- B2B SEO Expert: How to Hire One Who Drives Revenue
- B2B SEO Audit: Fix What’s Costing You Pipeline
- SEO for B2B Companies: Diagnose Before You Cut It
- B2B Tech SEO: Your Whole Market Fits on One Sheet
- B2B Local SEO: The Playbook Most Marketers Get Wrong
- B2B SEO Keywords: How to Choose Ones That Convert
- Best SEO Platform for B2B: A 2026 Buyer’s Guide
Last Updated on 2 months ago by Alipio Umiten IV