




SXO starts where rankings stop telling the truth.
Your page holds position three. Impressions rise. Traffic falls.
The dashboard shows no obvious problem. Google still ranks the keyword, the page still loads, and visibility continues to grow. Yet sessions decline and revenue follows. Then a senior stakeholder asks what happened, and “AI Overviews” no longer explains enough.
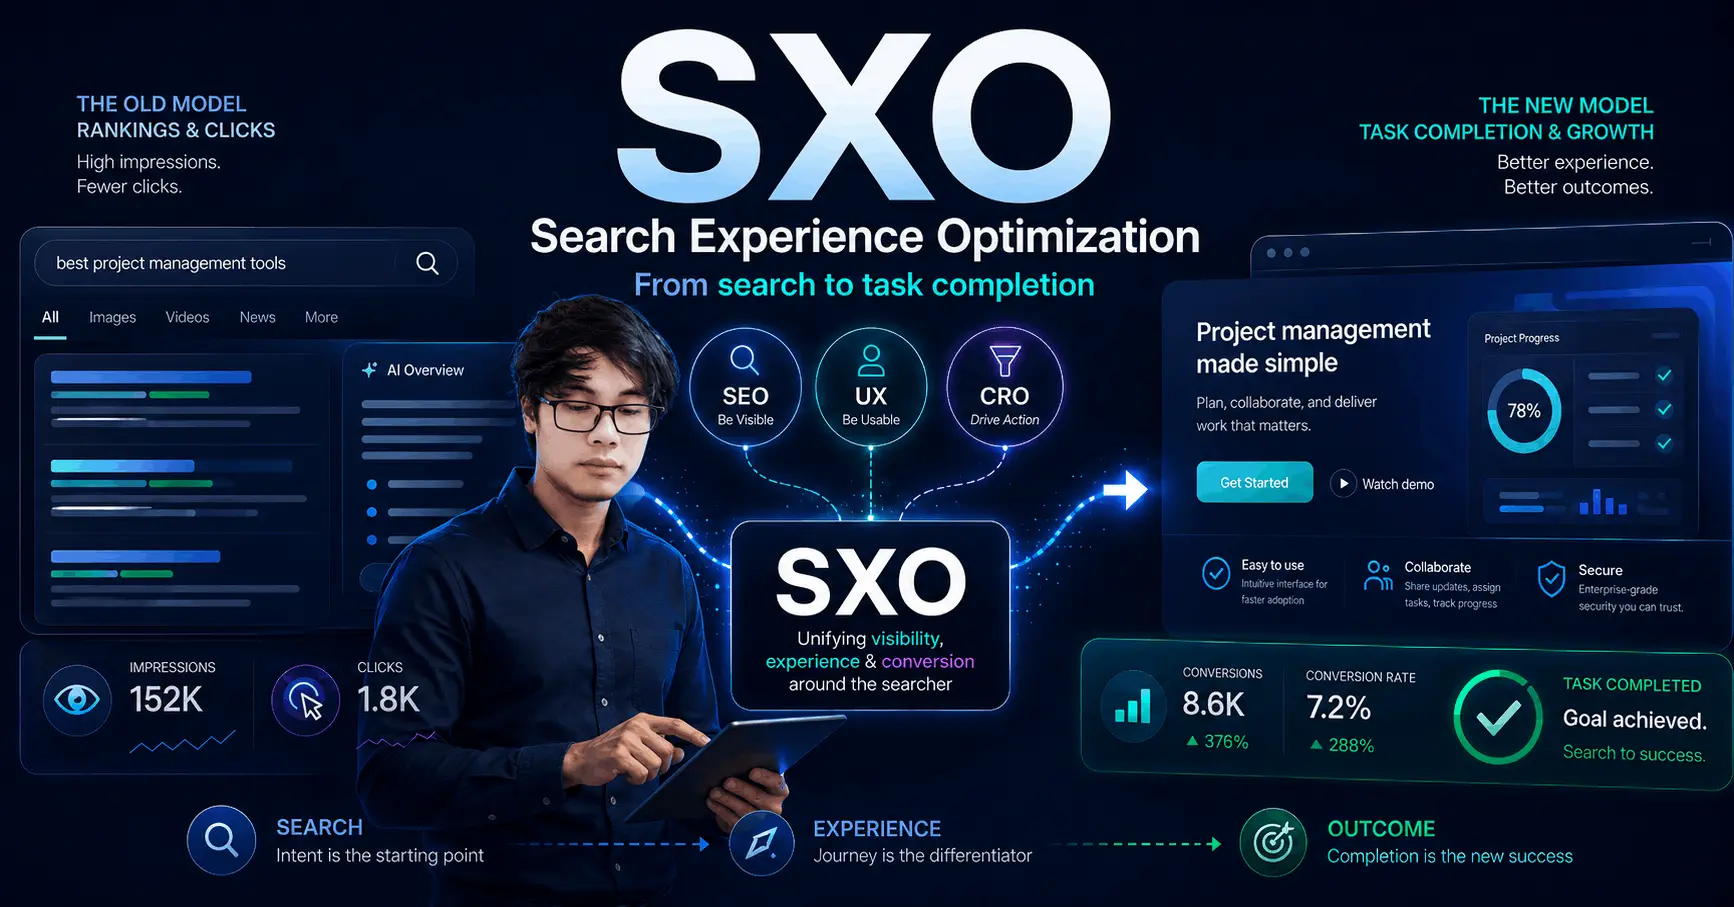
Search Experience Optimization solves this disconnect. SXO improves the full journey from the search query to the final action. It does not stop at rankings or clicks. It asks whether the searcher found the right answer, completed the task, and created value for the business.
Many guides describe SXO as SEO plus UX plus CRO. That formula sounds neat, but it does not tell you what to change.
This guide does. You will learn why search traffic has changed, which common SXO advice gets the problem wrong, how to audit a page using five practical checkpoints, and what to measure when clicks no longer reflect your true search performance.
What is SXO?
Search Experience Optimization treats a search as successful only when the searcher finishes what they came to do.
That is a real shift, not a semantic one. Traditional SEO measures success at the moment of the click. SXO measures it at the moment of resolution, which might happen on your product page, in your pricing table, or on the results page itself without any visit at all.
The practical consequence: a page ranking third that sends people back to Google in four seconds is failing, even though every SEO dashboard shows it winning.
Why SXO got urgent: the click math changed
The acronym is new. The pressure behind it is arithmetic.
SparkToro’s June 2026 study, built on Similarweb clickstream data, found that 68.01% of US Google searches ended without a click during the first four months of 2026. The 2024 figure was 60.45%. That 7.5-point move in two years is the steepest SparkToro has recorded since it started tracking the metric, and the study excludes searches made inside the Google app, where zero-click behavior is likely higher still.
AI Overviews are doing a lot of that work. They now appear on more than 20% of Google searches, and Ahrefs’ December 2025 analysis of 300,000 keywords found position-one click-through rate drops 58% when one is present, up from 34.5% in April 2025. Pew Research, tracking the actual browsing of 900 US adults, found people clicked a traditional result on 8% of searches showing an AI summary versus 15% of searches without one.
Estimates vary by methodology. Seer Interactive measured a 61% organic CTR decline across 3,119 informational queries. Google disputes the framing of several of these studies. Different instruments, same direction.
The losses are not evenly distributed
Here is the part most coverage skips, and it changes the strategy completely.
Semrush’s intent research found informational queries go zero-click about 74% of the time, while transactional queries sit near 31%. AI Overviews trigger when a query is best answered by synthesizing several sources, which describes informational intent almost exactly. They rarely trigger on “book a plumber in Leeds” or someone typing your brand name.
So the traffic disappearing is disproportionately your top-of-funnel explainer traffic. The traffic surviving is disproportionately people ready to act.
That inversion is the whole argument for SXO. Zero-click search did not take your visits uniformly. It sorted them. When visits get scarcer and more commercially loaded, the return on improving value per visit rises sharply while the return on chasing raw volume falls.
You are no longer running a traffic business. You are running a conversion business with a traffic problem.
SXO vs SEO vs CRO vs GEO
These overlap heavily, which is why the terms get muddled. The cleanest way to separate them is by the question each one asks.
| Discipline | The question it asks | Success looks like |
|---|---|---|
| SEO | Can engines crawl, understand, and rank this? | Position 3 for a target query |
| CRO | Does this page convert the people already on it? | Form completion up 1.2 points |
| UX | Is this usable, clear, and accessible? | Task done in fewer steps |
| GEO / AEO / LLMO | Do AI answers cite and describe us accurately? | Named inside the AI Overview |
| SXO | Did the searcher finish what they came for? | Query resolved, click or no click |
SXO is the umbrella that forces these teams onto one scoreboard. In most organizations SEO reports sessions, CRO reports conversion rate, and nobody owns the handoff between them. That unowned seam is where the money leaks.
The myth that ruins most SXO advice
Search “SXO” and you will read some version of this: Google punishes pages with high bounce rates, so improve your UX to rank better.
The first half is wrong. Google has stated repeatedly that it does not use your Google Analytics data as a ranking input, and John Mueller has confirmed bounce rate is not a direct factor. It would be a strange system if it were, since sites without tracking code would be scored differently from sites with it.
What is true is more specific and more useful. Google’s NavBoost system re-ranks results using roughly 13 months of aggregated click data. Pandu Nayak, Google’s VP of Search, described it under oath in the 2023 DOJ antitrust trial as one of the important signals Google has, and the 2024 Content API Warehouse leak surfaced the underlying fields: goodClicks, badClicks, and lastLongestClicks. A quick return to the results page is classified as a bad click.
So the behavior your bounce rate approximates does matter. The number in your GA4 dashboard does not.
Two things follow.
Stop optimizing the metric and start optimizing the moment. A visitor who lands, reads your 400-word answer in 90 seconds, and leaves satisfied is a good outcome that registers as a bounce. A visitor who lands and hits back in three seconds is a genuine failure. Same metric, opposite meanings.
Be honest about how much page experience moves rankings. Core Web Vitals have been a confirmed signal since June 2021, but Google has consistently framed them as a tiebreaker between comparably relevant pages, not a trump card. Relevance and authority still dominate. The stronger case for speed is commercial: Deloitte and Google’s 2020 “Milliseconds Make Millions” study measured a 0.1 second mobile improvement producing 8.4% higher retail conversions and 9.2% higher average order value.
Fix the experience because it earns money. The ranking benefit is a bonus, not the thesis.
The five-point SXO audit
Walk one high-value page through these checkpoints in order. Stop at the first failure, because failures upstream make everything downstream irrelevant.
1. Intent match: does the page do the job the query implies?
Search your target keyword in an incognito window and read the top five results as a set. If they are all comparison tables and you published a narrative essay, you have an intent mismatch, and no amount of design polish will fix it.
Check the SERP features too. A People Also Ask block tells you which sub-questions Google considers part of the job. A shopping carousel tells you the query is transactional, whatever your keyword tool says.
Fix: match the dominant format first, then differentiate inside it.
2. The first screen: is the answer visible without scrolling?
The searcher may have already read a summary above your result. They clicked anyway, which means they want something the summary did not give them. Making them scroll past a 200-word preamble to find it is how you earn a bad click.
Fix: lead with the direct answer in the first two sentences, then expand. Move the origin story below the fold or delete it.
3. Speed and stability: does the page hold still and respond?
The thresholds, measured at the 75th percentile of real Chrome user data over a trailing 28-day window:
- LCP (loading) at or under 2.5 seconds
- INP (responsiveness) at or under 200 milliseconds
- CLS (visual stability) at or under 0.1
All three must pass simultaneously. Two out of three is a fail. Per the 2025 Web Almanac from HTTP Archive, only 48% of mobile origins clear all three, so this is a live differentiator rather than table stakes.
Ignore the advice telling you INP is your likely problem. That was true in 2024, right after INP replaced First Input Delay. It is not true now: on mobile, 77% of origins pass INP and 81% pass CLS, but only 62% pass LCP. Loading is the bottleneck, and the usual causes are unglamorous. Oversized hero images, slow server response, render-blocking resources.
One trap worth naming: your Lighthouse score is a lab simulation and feeds nothing. Only field data from the Chrome User Experience Report counts. A page can score 100 in Lighthouse and still fail.
Fix: pull field data from Search Console, start with LCP on mobile, and give any change 28 days before you judge it.
4. The next step: is there exactly one obvious action?
Count the calls to action above the fold on your top landing page. If the answer is more than two, you have not designed a path, you have offered a menu.
Fix: one primary action per page, phrased as the outcome the visitor wants rather than the action you want. “See pricing” beats “Learn more.” “Get the template” beats “Submit.”
5. The SERP itself: are you useful where no click happens?
Two thirds of searches end there. Being helpful on the results page is now part of the experience you are optimizing, not a consolation prize.
Seer Interactive’s September 2025 study found brands cited inside an AI Overview earned 35% more organic clicks than uncited brands on the same queries (0.70% CTR versus 0.52%). Worth noting what that number is not: both figures sit far below the 1.45% those queries returned with no AI Overview present. Citation cushions the fall. It does not reverse it.
Fix: implement structured data for FAQs, products, reviews, and organization details. Write self-contained answers in the 40 to 60 word range that can be lifted whole into a snippet. Keep your Google Business Profile current if you serve a local market, where a phone call often replaces the visit entirely.
What to measure when clicks stop telling the truth
Reporting sessions in a 68% zero-click market produces the wrong strategic decisions. Swap in metrics that survive the shift.
Conversions per session, not conversion rate alone. If traffic drops 20% while conversions hold, your SXO is working and your traffic report is lying about it.
Impressions versus clicks, segmented by intent. Rising impressions with falling clicks on informational queries is the expected pattern, not a failure. The same pattern on transactional queries is an emergency.
Return-to-SERP rate. You cannot see this directly. Proxy it with the share of organic sessions under 15 seconds with no scroll, tracked per landing page. It is the clearest signal that your snippet over-promised.
Task completion rate. Define one primary task per page template (calculator used, comparison viewed, spec sheet downloaded, demo booked), instrument it as an event, and track the percentage of organic sessions that finish it. This is the single most useful number you can build.
Branded search volume trend. The most reliable proxy for visibility that never generated a click. Practitioners report meaningful branded lifts following visibility gains, though the lag varies widely by category.
Similarweb’s June 2026 study of thousands of user journeys across finance, travel, and beauty found that people shown an AI brand recommendation were 2.5 times more likely to visit that brand’s website within seven days. Nearly 56% of those AI-influenced visits arrived through search, usually through a branded query. Treat the result as directional rather than universal: the research covered only three categories and measured visits, not purchases.
Citation presence in AI answers. Whether you appear when someone asks Gemini or ChatGPT a question in your category, and whether the description is accurate.
When a stakeholder says traffic is down so SEO is failing, this set gives you the counter-argument: impressions up, branded search up, and the traffic still arriving converting at a higher rate.
One caution on the conversion-quality story. Semrush’s June 2025 research found visitors referred from AI assistants converted at 4.4x the rate of traditional organic visitors, and that finding gets recycled as proof that post-AI-Overview organic clicks convert better too. Those are different traffic sources measured different ways. Verify the claim against your own GA4 channel data before you put it in a deck.
Is SXO just SEO with a new label?
Partly, yes. Competent SEOs have matched intent and cared about post-click experience for over a decade. Nothing in the five-point audit above would surprise a good practitioner in 2018.
But the label earns its place for one unglamorous reason: it settles budget arguments. “Improve UX” loses to “build more links” in most planning meetings, because only one of them has historically been credited with revenue. SXO reframes the work as search performance, which is the language the budget responds to.
Use the term if it helps you get the work approved. Ignore it if the work is already happening. Be skeptical of anyone selling SXO as a replacement for technical fundamentals, because that is a rebrand rather than a discipline.
The takeaway
Ranking was never the goal. It was a proxy for the goal, and a decent proxy while most searches still produced a click. That era ended quantitatively, not philosophically, and the numbers are on the record.
SXO is the correction: optimize for the searcher finishing the job, measure value per visit rather than visit count, and stay useful on the results page for the two thirds of searches that never reach you.
Start here. Pick your five highest-revenue landing pages. Run each through the five checkpoints above and note the first one that fails. Fix that single point across all five pages before touching anything else.
One afternoon of intent-matching usually outperforms a quarter of content production.
Frequently Asked Questions About SXO
What does SXO stand for?
SXO stands for Search Experience Optimization. It combines Search Engine Optimization (SEO), User Experience (UX), and Conversion Rate Optimization (CRO). Its goal is not only to attract visitors from search engines but also to give them a smooth, relevant experience that encourages them to take action.
How long does it take to see SXO results?
Most websites begin to see measurable SXO results within three to six months. The timeline depends on factors such as the website’s current performance, competition, technical issues, content quality, and how consistently improvements are implemented.
What are the benefits of SXO?
SXO can improve search visibility, user satisfaction, engagement, conversion rates, and brand trust. It helps attract visitors with genuine intent and gives them a better experience, increasing the likelihood that they will make a purchase, subscribe, submit an inquiry, or complete another desired action.
What is the future of SXO?
SXO will become increasingly important as search engines and AI-powered platforms focus more on relevance, usability, and user satisfaction. Businesses will need to create content that is easy to discover, genuinely helpful, and supported by a fast, accessible, and intuitive website experience.
What is the difference between SEO and SXO?
SEO primarily focuses on improving a website’s visibility and rankings in search results. SXO goes further by combining SEO with UX and CRO, helping businesses attract the right visitors, keep them engaged, and guide them toward conversion.
What is the role of AI in SXO?
AI supports SXO by analyzing search intent, user behavior, content performance, and website data. It can identify optimization opportunities, improve content relevance and readability, personalize user experiences, and help businesses make faster, data-driven decisions.
What is SXO in marketing?
In marketing, SXO is a strategy that connects search visibility with the overall website experience. It ensures that users can find the right content through search engines and then navigate, understand, and interact with the website easily.
How important is site speed for SXO?
Site speed is essential for SXO because slow-loading pages can frustrate users, increase bounce rates, and reduce conversions. A fast website creates a smoother experience, strengthens trust, and makes it easier for visitors to complete actions such as purchasing a product or submitting a form.
Last Updated on 2 months ago by Alipio Umiten IV
