





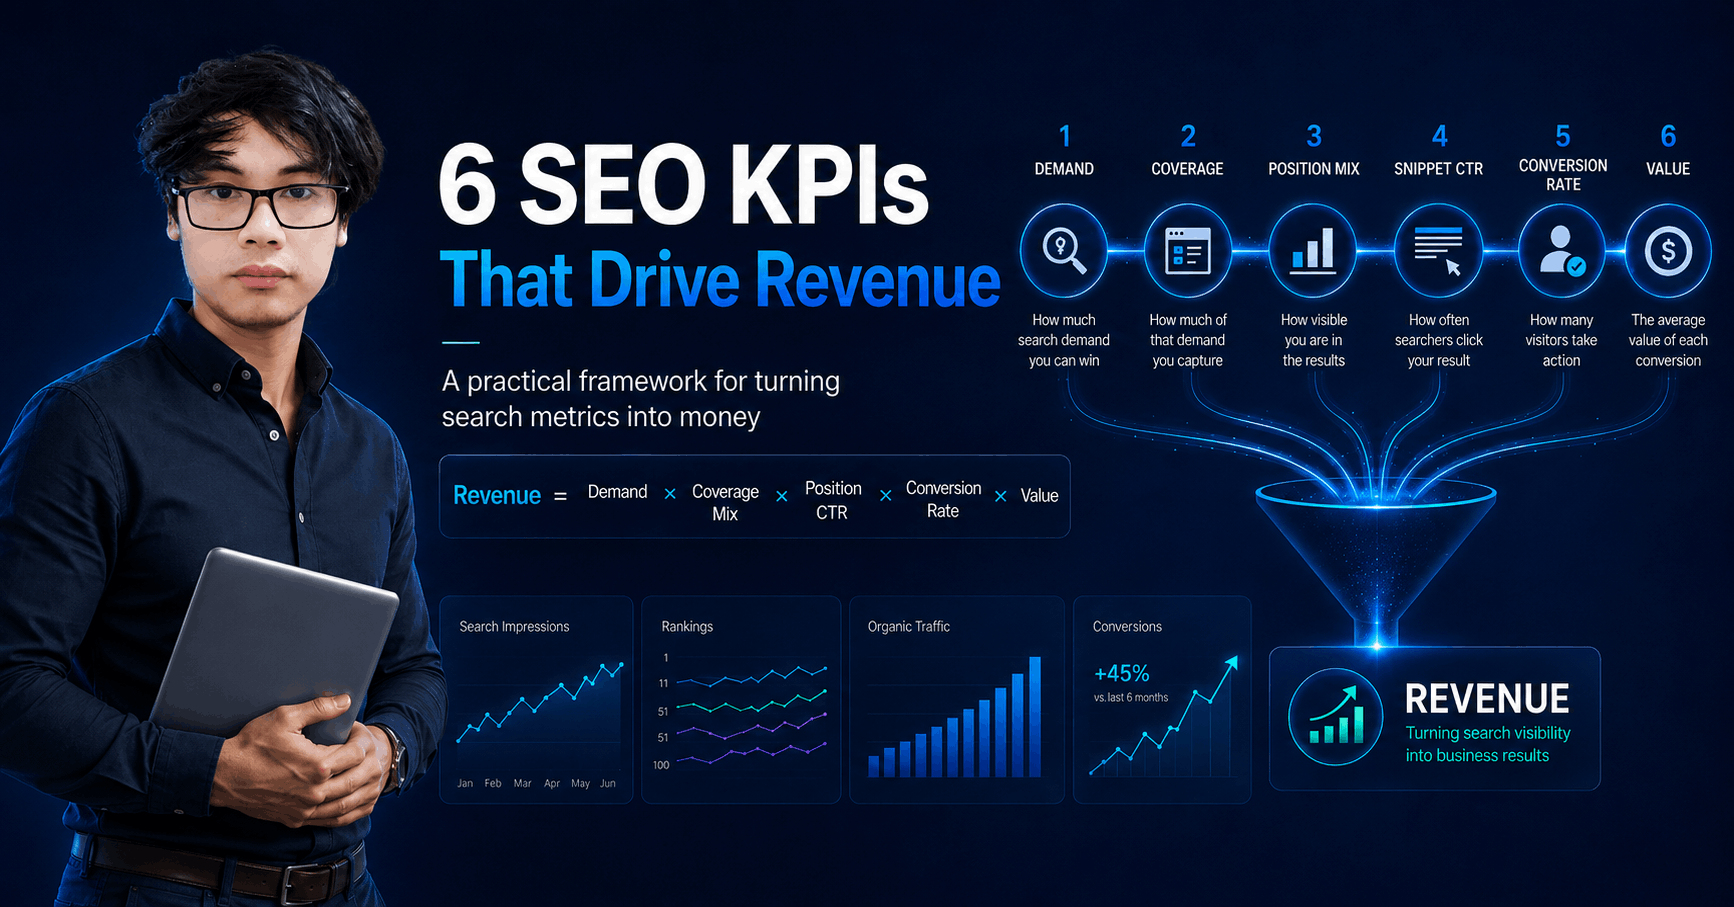
SEO KPIs should prove how search performance creates business value. Most dashboards fail because they collect dozens of numbers without showing how those numbers connect to revenue.
Impressions sit beside domain rating, backlink counts, and average position, but none of them tells your CFO what SEO actually contributes. When budget season arrives, saying that average position improved from 11 to 7 will not protect your investment or justify more spending.
You do not need a better chart. You need a measurement system that connects every primary KPI to a single equation ending in revenue. Each metric should have a clear owner, a practical lever, and a direct role in improving business performance. Anything that does not contribute to that equation should serve as a diagnostic, not a headline result.
This guide breaks down the six SEO KPIs that matter, explains how they work together, and shows you how to set targets you can defend. You will also learn how to report SEO performance to executives, identify the factors limiting growth, and use the same framework to evaluate an SEO agency.
The test that kills most SEO KPIs
Every framework offers a test. “Would you change a decision?” is the common one. It is too generous, because a determined SEO can attach a decision to almost any number.
Use a harder test: can you multiply this number by another number and get closer to revenue?
Domain rating fails instantly. There is no arithmetic that turns 48 into dollars. Total backlinks fails. Bounce rate fails. Average position fails, because it is a mean across a keyword set you control, and you cannot multiply a mean by anything meaningful.
Organic conversion rate passes. Multiply it by sessions and you get conversions. Multiply conversions by value and you get revenue. That number has a job.
Apply this to your last monthly report. Most teams find two or three survivors out of thirty.
The equation your SEO KPIs should fit into
Here is the chain, from search demand to money:
Revenue = Demand × Coverage × Position mix × Snippet CTR × Conversion rate × Value
| Factor | What it measures | Who owns it | Main lever |
|---|---|---|---|
| Demand | Total monthly searches across your priority query set | Nobody | Market selection |
| Coverage | Share of that query set where you have a live, indexed, eligible page | Content and SEO | Publishing and indexation |
| Position mix | Share of covered queries sitting in positions 1 to 3 | SEO | Authority, relevance, internal links |
| Snippet CTR | Clicks ÷ impressions, measured against your own curve at that position | SEO and copy | Titles, descriptions, structured data |
| Conversion rate | Key events ÷ organic sessions, by page cluster | Web, CRO, product | Page design, offer, message match |
| Value | Revenue or pipeline per conversion | Sales and finance | Pricing, qualification, close rate |
This is a model, not accounting. It will not reconcile to the penny with your CRM. What it will do is tell you which factor to attack next and, when a target is missed, which factor broke.
A worked example
Take a B2B software company with a defined non-brand priority cluster. Illustrative figures:
- Demand: 180,000 monthly searches across the cluster
- Coverage: 35%, so 63,000 addressable impressions
- Position mix and snippet CTR combine to a blended 4% click-through rate, giving 2,520 clicks
- Conversion rate: 2.4%, giving 60 conversions
- Value: $1,800 in pipeline per conversion
Multiply through and organic search produces roughly $109,000 in pipeline per month.
Now improve three factors modestly. Coverage from 35% to 45%. Blended CTR from 4.0% to 4.8%. Conversion rate from 2.4% to 2.9%.
The result is about $203,000 per month. The channel nearly doubled and no single factor moved more than 29%.
Why multiplication changes the target conversation
Leadership asks for a number like “double organic pipeline” and the SEO team panics, because doubling traffic in a year is a hard promise to make.
Doubling traffic was never the requirement. Three factors improving by roughly a quarter each gets you there, and those three factors sit with three different teams. That reframes the ask from a heroic content sprint into a coordinated plan with distributed accountability.
It also exposes the zeros. If coverage on your highest-value cluster is 0%, every other factor is irrelevant. No amount of technical work or link acquisition rescues a multiplication that contains a zero. Find your zeros before you optimize anything.
Why it changes the diagnosis conversation
When revenue misses, divide instead of guessing.
Organic pipeline fell 30% last quarter. Walk the factors. Demand down 22% because the category cooled. Coverage flat. Position mix flat. CTR flat. Conversion rate flat.
That is a market story, not a performance story, and you now hold the arithmetic to say so. Your relative position actually improved, because you held every controllable factor while the market shrank.
Compare that with a different pattern: demand flat, position mix flat, CTR down 25%. That is an AI Overview or snippet problem, and it is fixable in weeks rather than quarters. Same headline miss, completely different response.
The six SEO KPIs, factor by factor
1. Demand on your priority query set
The factor almost nobody reports, and the one that most often explains a miss.
Sum the monthly search volume of your defined priority keywords and track it as an index over time. Search Console impressions on a fixed query set work as a proxy, as does a trends tool.
If your category’s search demand falls 15% in a year, flat non-brand clicks represent a gain in share. Reporting without this factor means taking blame for weather.
Cadence: quarterly. Lag: none, it moves independently of you.
2. Coverage of the priority query set
Build a topic map of the queries you intend to compete for. Then measure the percentage where you have a page that is live, indexed, and genuinely relevant to the query.
Not pages published. Not pages indexed sitewide. The percentage of your target map that is actually addressable.
This is the fastest factor to move and the one most teams underestimate, because publishing counts feel like progress while coverage of the money cluster stays at 30%.
Cadence: weekly. Lag: days.
3. Position mix on money keywords
Track distribution, never the average. How many priority keywords sit in positions 1 to 3, how many in 4 to 10, how many in 11 to 20, and how the migration between buckets runs month over month.
Ten keywords moving from page two to page one is a real event worth real money. Average position moving 0.4 is noise, and it improves whenever you gain irrelevant long-tail visibility or lose impressions on hard terms.
Cadence: monthly. Lag: one to four months.
4. Snippet CTR against your own curve
Pull your own click-through-rate-by-position curve from Search Console. Then flag every page ranking well below the curve for its position.
Do not borrow a published benchmark. Compiled figures for position one currently range from about 19% to 39.8% depending on the study, device, and whether an AI Overview is present, which makes any single external number close to useless for target setting. Your own data is the only curve that describes your SERPs.
A page at position four earning 2% when your curve says 8% has a title problem, an intent mismatch, or a SERP feature taking the click above it. That fix costs a few hours and no new content.
Cadence: monthly. Lag: days to weeks.
5. Conversion rate by landing page cluster
Segment organic landing pages by intent, then track conversion rate for each: informational guides, comparison pages, product or solution pages, location pages.
A single blended number hides everything. Discovering that comparison pages convert at 4.1% while top-of-funnel guides convert at 0.2% tells you exactly where the next ten pages go.
Discount new-visitor unfamiliarity when you forecast. Take the historical rate for that page type and shave roughly 20% off it before you multiply through to a revenue figure.
Cadence: monthly. Lag: weeks.
6. Value per conversion
The factor SEO teams treat as somebody else’s problem, which is why so many SEO reports stop at lead volume.
For ecommerce, use revenue per order and margin where you have it. For B2B, use closed-won rate multiplied by average deal size to get a pipeline value per conversion, and pull it from the CRM rather than estimating.
Without this factor you cannot compute organic cost per acquisition, and organic CAC against paid CPA is the single most persuasive sentence in any SEO report.
Cadence: quarterly. Lag: one to three quarters, longer on enterprise sales cycles.
Split branded from non-branded or the equation breaks
Brand queries poison every factor in the chain.
Brand demand rises when your podcast sponsorship runs, when a competitor has an outage, or when your founder goes viral. Brand queries convert at multiples of non-brand rates because those people already decided. Blend them in and your conversion rate factor becomes a measure of your PR team’s month.
Set up a regex filter in Search Console for your brand name, product names, founder name, and common misspellings. Save it permanently. Report both lines, headline the non-brand number, and never let the two merge again.
This one change does more for reporting honesty than any tool you could buy.
The metrics that are not factors
These are useful. They just cannot be multiplied by anything, so they belong in the diagnostic layer.
| Retire from the headline | Why it is not a factor | Keep it for |
|---|---|---|
| Domain authority / domain rating | A vendor’s model of a Google signal, not a Google signal | Rough competitive triage |
| Total backlinks | Quality-blind and trivially inflated | Spotting toxic link spikes |
| Average position | A mean you can improve by dropping losing terms | Nothing much on its own |
| Total impressions | Rises with irrelevant reach, and no longer comparable across time | Detecting new query territory |
| Bounce rate | A high figure on a page that answered the question is a success | Finding broken UX |
| Pages published | Measures effort, not coverage of anything | Capacity planning |
| Core Web Vitals | A threshold to pass, not a growth lever | Passing, then moving on |
| Total ranking keywords | Grows on its own as pages get indexed for junk | Almost nothing |
Core Web Vitals deserves a specific note. Pass the thresholds, confirm it, then stop reporting it. Speed beyond the threshold does not multiply into revenue.
How to set SEO KPIs you can defend
“Increase organic traffic 30%” is a wish. Nobody can say where the 30% came from, which is why it gets quietly renegotiated the moment it is missed.
Build targets from the factors instead.
- Baseline twelve months, not three. A shorter window hides seasonality. Exclude any period distorted by a migration, an outage, or a tracking change.
- Measure each factor separately. Write down current demand, coverage, position mix, CTR, conversion rate, and value. Most teams discover at this point that they have never measured coverage at all.
- Model from capacity, not ambition. Estimate what coverage you can realistically add given the pages you will actually ship. Four pages a month against 2,000-volume clusters produces a very different forecast than twenty pages a month.
- Multiply forward, then sanity-check the total. If the product exceeds the entire addressable demand of your cluster, your assumptions are wrong somewhere.
- Set bands, not points. Commit to a floor, a target, and a stretch. “Non-brand organic conversions between 340 and 420 per month by Q4, base case 380” survives contact with reality. A single number invites arguments about rounding.
- Sequence by lag. Coverage targets belong in Q1, position and CTR targets in Q2, conversion and revenue targets in Q3 and Q4. Write the sequence into the plan so nobody expects revenue in month two.
- Attach a decision to each target. “If top-3 share is under 18% by the end of Q2, we halve blog cadence and move budget to comparison pages.” Written in advance that is strategy. Written after the miss it is an excuse.
A usable target statement names the factor it will move: “Increase non-brand organic conversions from 412 to 500 per month by Q4, holding conversion rate at or above 2.4%, by moving 30 commercial keywords from positions 4 to 10 into the top three.” Baseline, target, guardrail, mechanism. Anyone can audit that.
What changed in 2026, and what it does to your inputs
Two shifts broke inputs that many teams still treat as stable.
Your impression history is not comparable
Google stopped supporting the URL parameter that returned 100 results per page in mid-September 2025. Rank trackers and scrapers had relied on it, and every deep result those bots loaded had been counting as a Search Console impression.
The effect was large. An analysis of 319 properties by Tyler Gargula of LOCOMOTIVE Agency found that 87.7% of sites saw impressions decline and 77.6% saw their count of unique ranking queries fall, with the losses concentrated in short-tail and mid-tail terms. Clicks held steady, and average position appeared to improve, because the low-ranking bot impressions dragging the mean down had vanished.
Nothing changed in the rankings. The measurement changed.
Two responses. Annotate September 2025 in your dashboards as a data-integrity break, and use clicks and conversions as your historical series rather than impressions.
CTR became a moving target
AI Overviews reshaped the click side of the equation, and the published research disagrees about how much.
Ahrefs put the CTR drop for the top-ranking page at roughly 34.5% across 300,000 keywords, with a sharper 58% estimate by December 2025. Seer Interactive, studying 53 brands and billions of impressions, found suppression through 2025 followed by a partial rebound in early 2026, with CTR on AI Overview queries recovering from about 1.3% in December 2025 to 2.4% in February 2026 while CTR on queries without AI Overviews rose over the same period.
The practical conclusion is not a number. It is that CTR now varies enough by query type and SERP composition that borrowed benchmarks will mislead you, and your own curve is the only defensible input.
AI visibility is a coverage KPI, not a revenue factor yet
Google launched dedicated Search generative AI performance reports in Search Console on June 3, 2026, breaking out impressions from AI Overviews, AI Mode, and generative features in Discover.
Read the limitations before you build a target on it. The report currently shows impressions only, with no clicks, click-through rate, or query data, and the rollout has been phased, beginning with a subset of properties in the UK. Google confirmed those impressions were always included in your overall totals, so your aggregate numbers did not change.
Treat generative impressions as a coverage signal. It answers whether you are in the answer. It cannot yet answer what that got you.
For LLM referral traffic, build a separate GA4 segment for ChatGPT, Perplexity, Gemini, Claude, and Copilot, then compare its conversion rate against non-brand organic. Do not import someone else’s ratio. Amsive’s study of 54 sites found the apparent conversion advantage of LLM traffic was not statistically significant once site-level variability was accounted for, with organic driving about 31.9% of sessions against 0.24% for LLM referrals. Adobe, meanwhile, reported AI-referred shoppers to US retail sites converting 42% better than other channels in March 2026, after converting 38% worse a year earlier.
Both can be true across different verticals and conversion events. Yours is an empirical question, and the sample size that matters is your own.
One cheap addition: put a “how did you hear about us?” field on your primary form. It catches the buyer who researched you inside an AI assistant, never clicked, and typed your URL a week later. Analytics logs that as direct.
Which SEO KPIs matter to executives
Executives are not hostile to SEO. They are comparing it against paid media, events, and headcount, and they need the comparison in a currency they already use.
Give them the product of the equation and two factors. Four numbers total:
- Organic revenue or pipeline, as an absolute figure and as a share of the total.
- Organic CAC against paid CPA. This is the number that moves SEO from a cost line to an efficiency lever. Include internal salary, content production, and engineering time, or the first person to audit it will destroy your credibility.
- Non-brand organic conversions, trended against target rather than against last month.
- One forward-looking factor. Coverage of the priority cluster works well, because it moves first and it is fully within your control.
Three habits that improve the exec conversation immediately. Lead with the number that connects to cash. Explain any movement in one sentence, then link to the detail. Report against a stated target, because month-over-month comparison invites seasonality arguments you cannot win.
An example of the one sentence: “Organic pipeline rose 18% year over year on the strength of the comparison-page cluster, and sits 7% below target because six integration pages missed their launch dates.” Result, cause, target status, blocker.
How to evaluate SEO agency performance with KPIs
Agency reporting is where vanity metrics do the most damage, because the agency chooses the metrics.
The factor model fixes the contract problem cleanly. Assign each factor an owner:
- The agency owns coverage, position mix, and snippet CTR.
- You own conversion rate and value per conversion.
- Nobody owns demand, so it goes in the report as context and never as a target.
That split ends the most common argument in the relationship, which is an agency being blamed for a landing page it never had permission to change.
Ask for these in the statement of work: non-brand clicks and conversions as headline KPIs with brand reported separately; a fixed priority keyword set agreed at kickoff and frozen for at least two quarters; direct read access to Search Console, GA4, and the rank tracker; and a quarterly forecast with stated assumptions.
Red flags in an agency report:
- Headline results built on total traffic or impressions with no brand split
- The reporting keyword set quietly changing between months, which drops the terms that did not move
- Domain rating growth presented as a result
- Rankings for keywords with no commercial relevance or near-zero volume
- Deliverable counts presented as outcomes (“we published 12 blogs”)
- Traffic growth with no conversion data attached
- No forecast, ever, in any deck
- Nothing that failed, ever
That last one matters most. An agency that never reports a failed test is either not testing or not telling you.
The question that settles it: ask what they expect non-brand organic conversions to be in six months, and what would have to be true for that to happen. A capable agency answers with a model. A weak one changes the subject to rankings.
A reasonable timeline: judge inputs and coverage in months 1 to 3, position mix and CTR in months 4 to 6, conversions and pipeline in months 7 to 12. If month twelve arrives with no movement in non-brand clicks, the engagement failed regardless of how good the decks looked.
How SEO content impacts marketing KPIs beyond search
The equation captures the revenue SEO is credited for. It systematically undercounts the revenue SEO causes, which is where most of the missing value sits.
Paid search efficiency. Ranking organically on terms you also bid on lets you cut or reallocate that spend. Quantify it directly: multiply current organic clicks on a term by that term’s CPC to get the equivalent media value.
Blended CAC. Organic acquisition cost is front-loaded and then compounds. As organic share of new customers rises, blended CAC falls even with paid spend flat.
Sales cycle and close rate. Prospects who read comparison and pricing content before a demo arrive better informed. Pull this from the CRM by comparing close rates for opportunities with and without prior organic content touches.
Brand demand. Sustained non-brand visibility feeds branded search volume over the following quarters. Track branded search as a lagging outcome of non-brand work, never as an SEO KPI in its own right.
Channel supply. Content built for search becomes nurture email, sales enablement, and social. The production cost is charged to SEO while the benefit lands in other channels’ numbers.
Assisted conversions. Configure a data-driven or position-based attribution model in GA4 and compare it against last-click. The gap is roughly the portion of SEO’s value your default reporting hides. Report it once, explain it once, and stop relitigating it every month.
The takeaway
An SEO KPI earns its place by multiplying into the next one. Demand, coverage, position mix, snippet CTR, conversion rate, and value. Six factors, six owners, one number at the end that finance recognizes.
Everything else is a diagnostic. Diagnostics are how you find the broken factor, and they are worth keeping. They are not worth reporting.
Do this today: open your last SEO report and cross out every metric that cannot be multiplied by another metric on the page. Then measure your coverage of the priority cluster, which is almost certainly the factor you have never quantified and the one you can move fastest. Send that number to whoever controls your budget before they have to ask for it.
Frequently Asked Questions About SEO KPIs
What SEO KPIs should I track if I am just starting?
Three: coverage of your priority query set, non-brand organic clicks, and organic conversions. Those cover input, visibility, and outcome. Add value per conversion once your CRM connection is trustworthy.
Which SEO KPIs matter most?
Non-brand organic conversions and organic CAC against paid CPA. One proves you earned new demand, the other proves it was cheaper than buying it. Every other KPI exists to explain those two.
How many SEO KPIs should I track?
Six committed KPIs, one per factor, plus whatever diagnostics your team needs in the appendix. Beyond six, nobody remembers the targets, which means nobody is accountable to them.
How long before SEO KPIs move?
Coverage moves in days. Position mix and CTR typically shift within one to four months. Conversions and revenue need one to three quarters, longer on new domains, in competitive categories, or with long sales cycles.
Are keyword rankings still a valid SEO KPI?
As position mix across a defined cluster, yes. As average position across every query you happen to appear for, no.
How do I set SEO KPIs?
Baseline twelve months, measure each factor separately, model coverage from real publishing capacity, multiply forward, set bands rather than points, sequence targets by lag, and attach a written decision to each one.
Can I track visibility in AI answers?
Partially. Search Console’s generative AI reports give impressions but no clicks, CTR, or query data, and access is still rolling out. Bing Webmaster Tools and dedicated prompt-monitoring tools add coverage. Treat all of it as directional.
Last Updated on 2 months ago by Alipio Umiten IV
